
Understanding Candlestick Patterns with Code Examples
Want to decode the language of the stock market? Learning candlestick patterns is one of the best first steps toward financial literacy and smart investing. Whether you’re a curious beginner or a company employee looking to upskill in finance and data analytics, understanding how price movements are visualized on a chart is a skill that pays long-term dividends.
In this guide, we’ll break down the basics of candlestick charts, explain key patterns, and even walk through some simple Python code examples to bring these concepts to life. No need to be a pro trader or a coding expert—we’re here to help you start strong.
What Are Candlestick Patterns?
Candlestick patterns are visual representations of price movements in financial markets—like the stock market or cryptocurrency. Each “candlestick” shows four key data points within a specific time frame:
- Open: The price when the period started
- High: The highest price during the period
- Low: The lowest price during the period
- Close: The price when the period ended
A series of candlesticks forms patterns that traders use to forecast future price movements. Think of them as market mood indicators.
Why Beginners Should Learn Candlestick Patterns
✅ Financial Awareness: Even basic knowledge can help you avoid risky investments.
✅ Market Timing: Understand when it might be a good time to buy or sell.
✅ Career Upskilling: Financial literacy is a valuable asset for roles in business, data analysis, and technology.
✅ Confidence Booster: Demystifying market charts can turn fear into confidence.
Common Candlestick Patterns You Should Know
1. Doji
- Represents indecision in the market.
- Opens and closes at nearly the same price.
- Could signal a potential reversal.
2. Hammer
- Appears at the bottom of a downtrend.
- Small body with a long lower wick.
- Often signals bullish reversal (buyers stepping in).
3. Shooting Star
- Appears at the top of an uptrend.
- Small body with a long upper wick.
- Signals potential bearish reversal (sellers gaining strength).
4. Engulfing Patterns
- A larger candle “engulfs” the previous one.
- Bullish engulfing after a downtrend = possible upward move.
- Bearish engulfing after an uptrend = possible downward move.
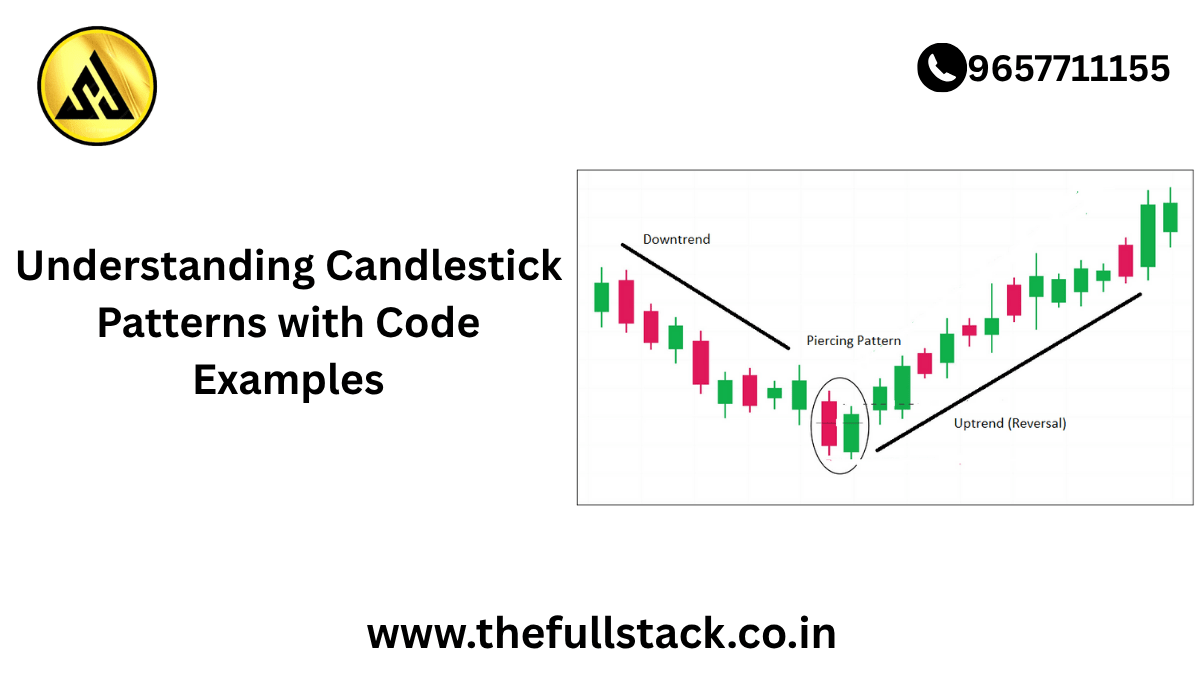
Real-World Application: Reading Market Trends
Let’s say you’re looking at a stock that’s been falling for weeks. Suddenly, you spot a hammer pattern. This could mean buyers are stepping in, and a price bounce might follow. Or maybe you’re eyeing a crypto asset with repeated doji candles—time to be cautious and watch for a breakout.
The beauty of candlestick patterns is that they work across different markets—stocks, forex, crypto—and across different timeframes.
Let’s Add Some Code! 📊
Want to visualize candlestick patterns with Python? Let’s use Plotly and Pandas to create a basic candlestick chart.
✅ Install required libraries:
bash
CopyEdit
pip install plotly pandas yfinance
🧠 Sample Code:
CopyEdit
import yfinance as yf
import plotly.graph_objects as go
# Get historical data for Apple
data = yf.download(“AAPL”, start=”2023-01-01″, end=”2023-12-31″)
# Create a candlestick chart
fig = go.Figure(data=[go.Candlestick(
x=data.index,
open=data[‘Open’],
high=data[‘High’],
low=data[‘Low’],
close=data[‘Close’]
)])
fig.update_layout(title=”AAPL Candlestick Chart”, xaxis_title=’Date’, yaxis_title=’Price’)
fig.show()
🎯 This script pulls Apple stock data and displays a candlestick chart, giving you a clear view of daily price movements—perfect for spotting trends and practicing what you’ve learned.
Tips for Beginners
🔹 Start Small: Begin by learning 2–3 patterns and spotting them in charts.
🔹 Use Simulators: Try virtual trading apps to practice without real money.
🔹 Stay Curious: Combine candlestick analysis with fundamental research for smarter decisions.
🔹 Avoid Overtrading: Patterns aren’t magic—they’re probabilities. Use them wisely.
Industry Insight: Why Companies Value This Skill
In industries like fintech, data analytics, investment banking, and even product management, understanding how financial markets move is a major advantage. If your job touches anything data- or finance-related, knowing how to read a candlestick chart can give you an edge when making decisions or discussing performance with stakeholders.
Your Financial Literacy Journey Starts Now 🚀
Whether you’re managing your personal investments, preparing for a career pivot, or just exploring a new hobby, candlestick patterns are a powerful tool in your toolkit. Don’t stop here—continue building your knowledge with deeper technical analysis, trading strategies, and machine learning applications in finance.
🎓 Explore More: Advance Your Learning
Ready to level up?
👉 Check out our Beginner-to-Pro Trading & Financial Analysis Courses
👉 Join our newsletter for weekly financial tips
👉 Access real-time market tools and webinars
Start small. Learn consistently. Win big—long term.
You might be like this:-
What is AWS Lambda?A Beginner’s Guide to Serverless Computing in 2025
Java vs. Kotlin: Which One Should You Learn for Backend Development?
Leave a Reply